Charts are "trellised" when multiple measures are added to the primary axis in the Values drop zone. The Component ribbon's Trellis options control the layout of the trellised visuals on the canvas. You can also change the trellis and axis options on the Formatting panel to further control the trellis appearance.
Accessing the Trellis Dropdown
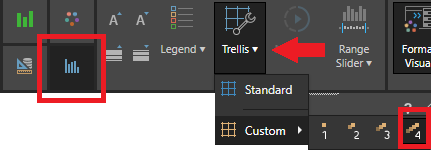
From the Component ribbon:
- Click Trellis to switch to Standard (default) trellising.
- To indicate the number of charts / visuals to include on each row, click the Trellis dropdown list and select Custom > <NUMBER>.
Standard Trellising
By default, the appearance of your trellis depends on your drop zone selection:
- Trellis Vertical: Vertical trellising includes one visual in each row by default.
- Trellis Horizontal: Horizontal trellising includes all of the visuals in one row.
Select Standard on the Trellis dropdown list to revert to the default trellis layout if you've customized your trellis.
For more information about standard trellising, including details of trellising where both vertical and horizontal trellises are in place, see Trellis Drop Zones.
Custom Trellising
Use the Custom dropdown menu to change the number of visuals to display per row from the submenu. You can select up to a maximum of 4 visuals.
Formatting Panel: Trellis
In addition to the Trellis options on the Component ribbon, you can also adjust the formatting of your trellis from the Formatting panel.
Formatting includes changes to font sizes and styles, the minimum height for the trellised visualizations to take (in pixels), and so on. For more information, see Trellis Axes.
Note: Most of the formatting options for trellis axes are only available if you have selected to use the Standard trellising option.
Examples
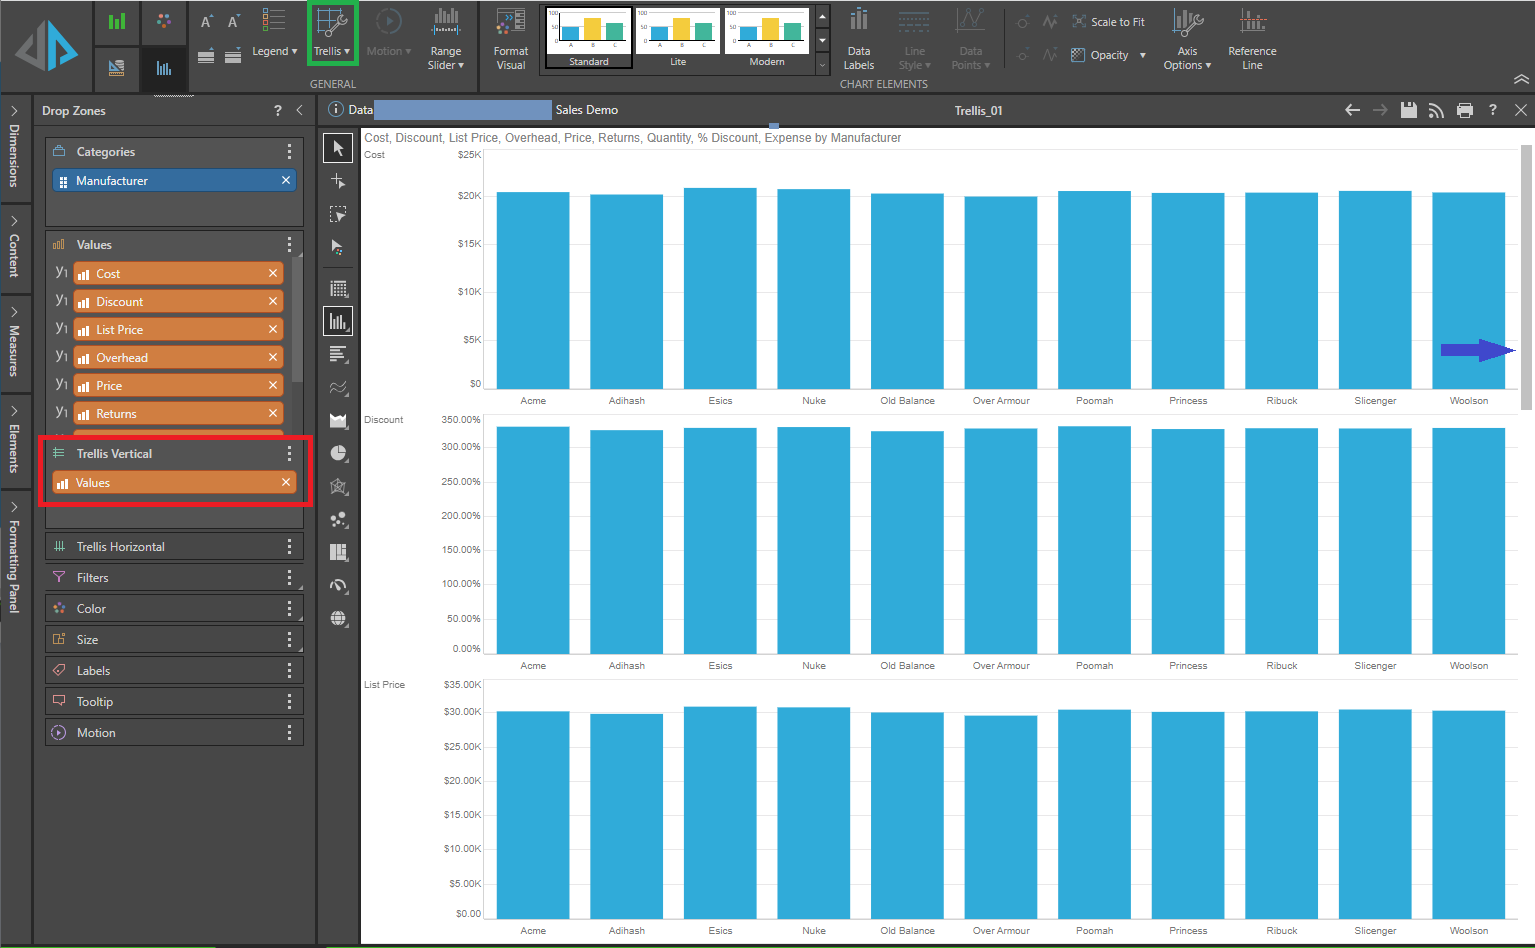
Example: Standard Trellising > Vertical
Where the number of visuals requires more than the available space, use the vertical scroll bars to view the visuals that cannot be shown (blue arrow).
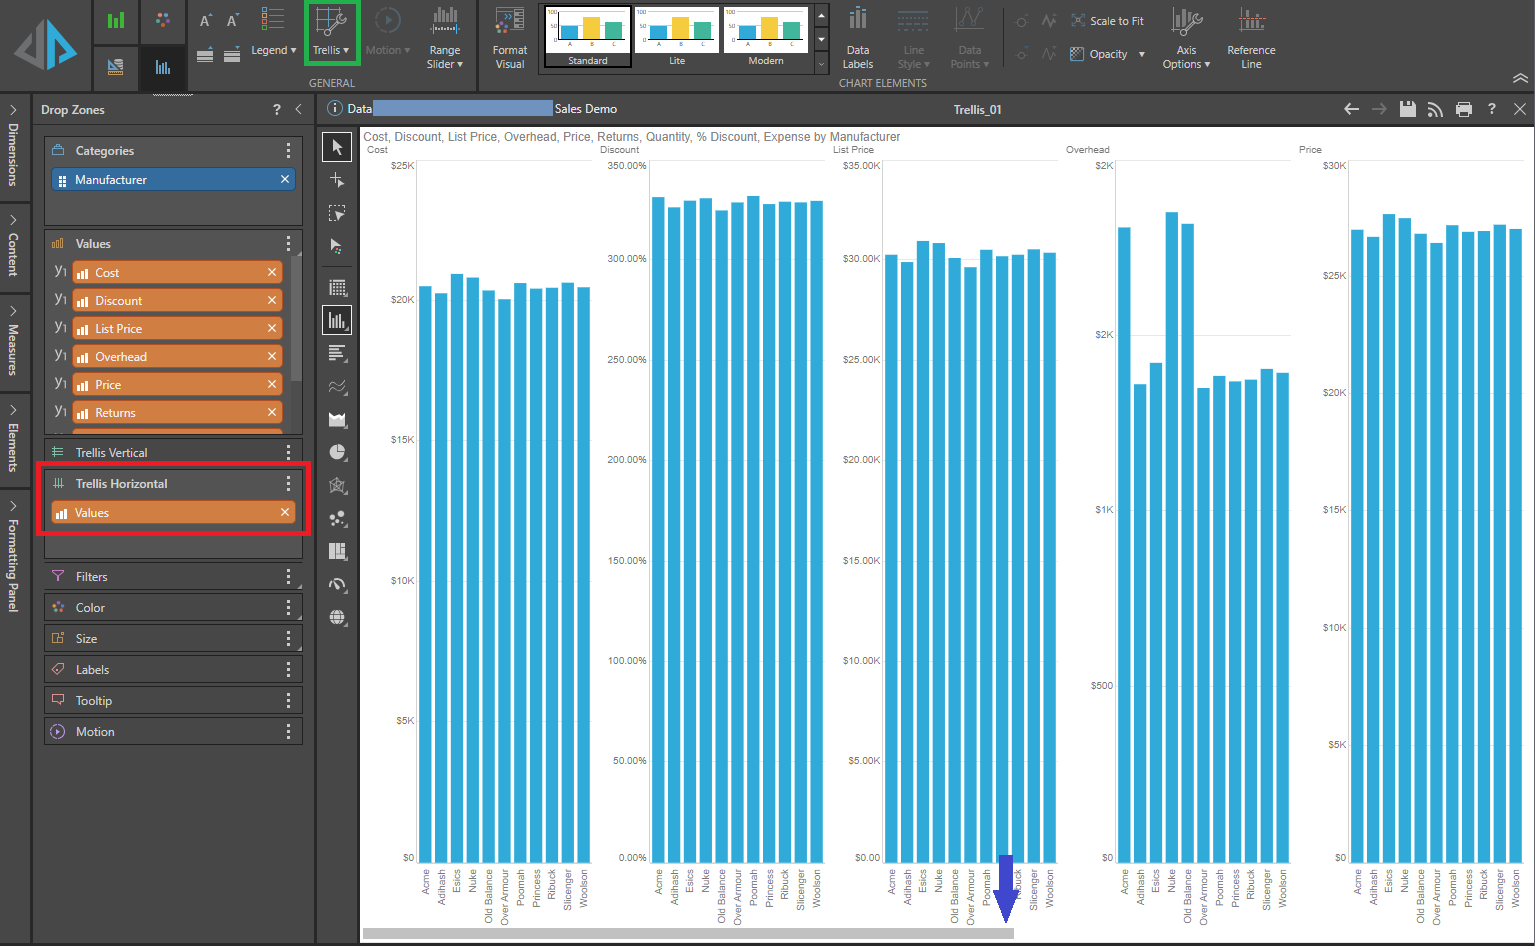
Example: Standard Trellising > Horizontal
Where the number of visuals requires more than the available space, use the horizontal scroll bars to view the visuals that cannot be shown (blue arrow).
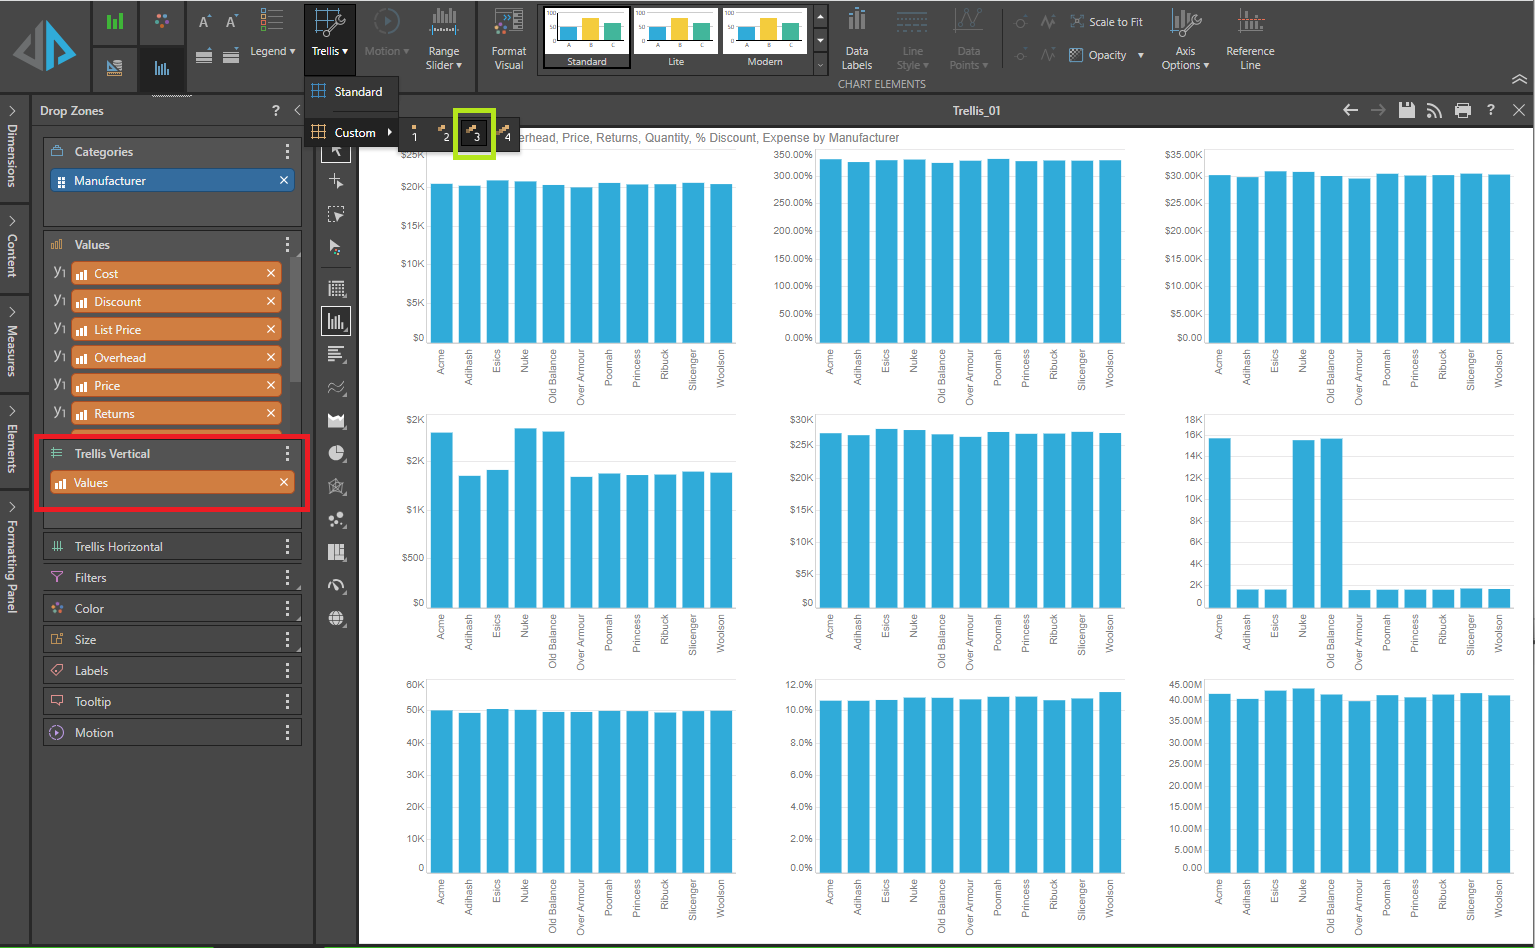
Example: Custom Trellising > Three Columns
In this example:
- Nine values are trellised vertically (red highlight below).
- The Custom trellis is set to 3 visuals per row (green).
This means that, by default, I now have three rows, each of which contains three visuals.